OHLC / OLHC
The lesson has four parts: an introduction, candle formation, key levels, and OHLC / OLHC.

The slides from the video, with an explanation under each one. Watch the video, then keep the PDF.
The lesson has four parts: an introduction, candle formation, key levels, and OHLC / OLHC.
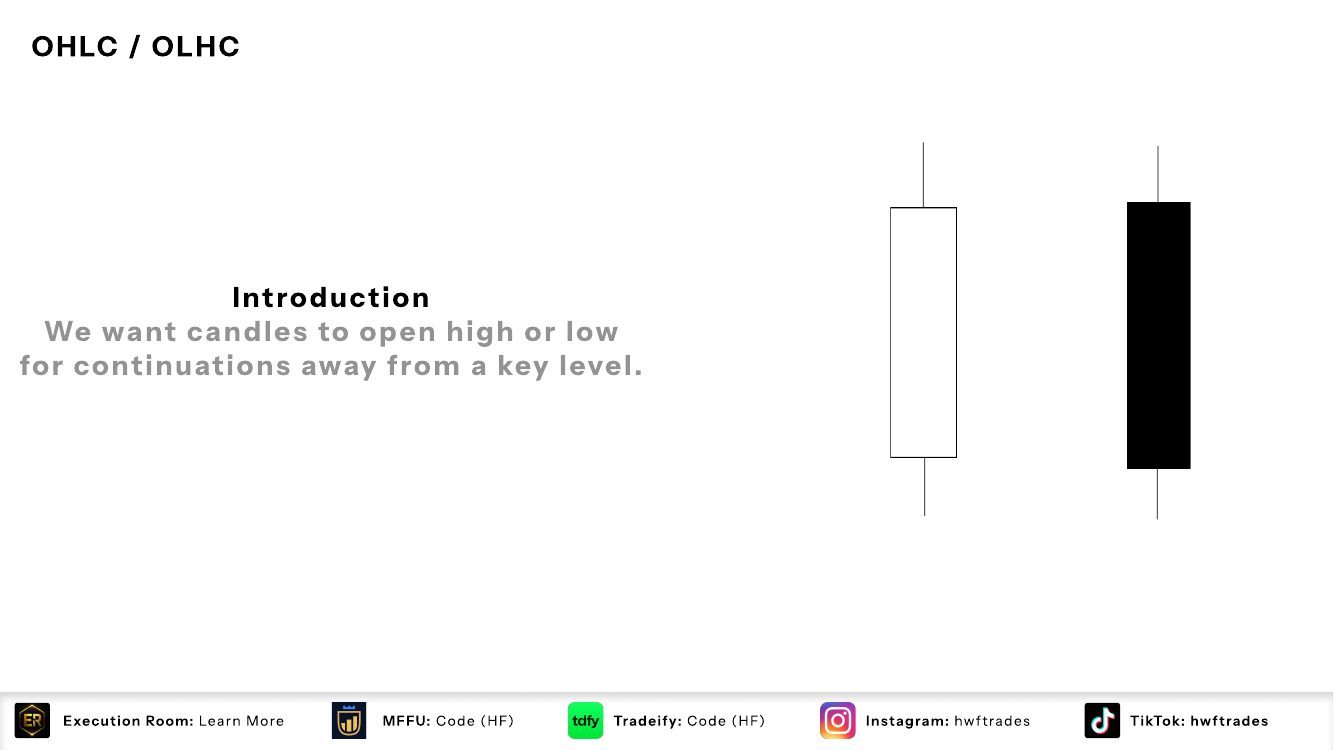
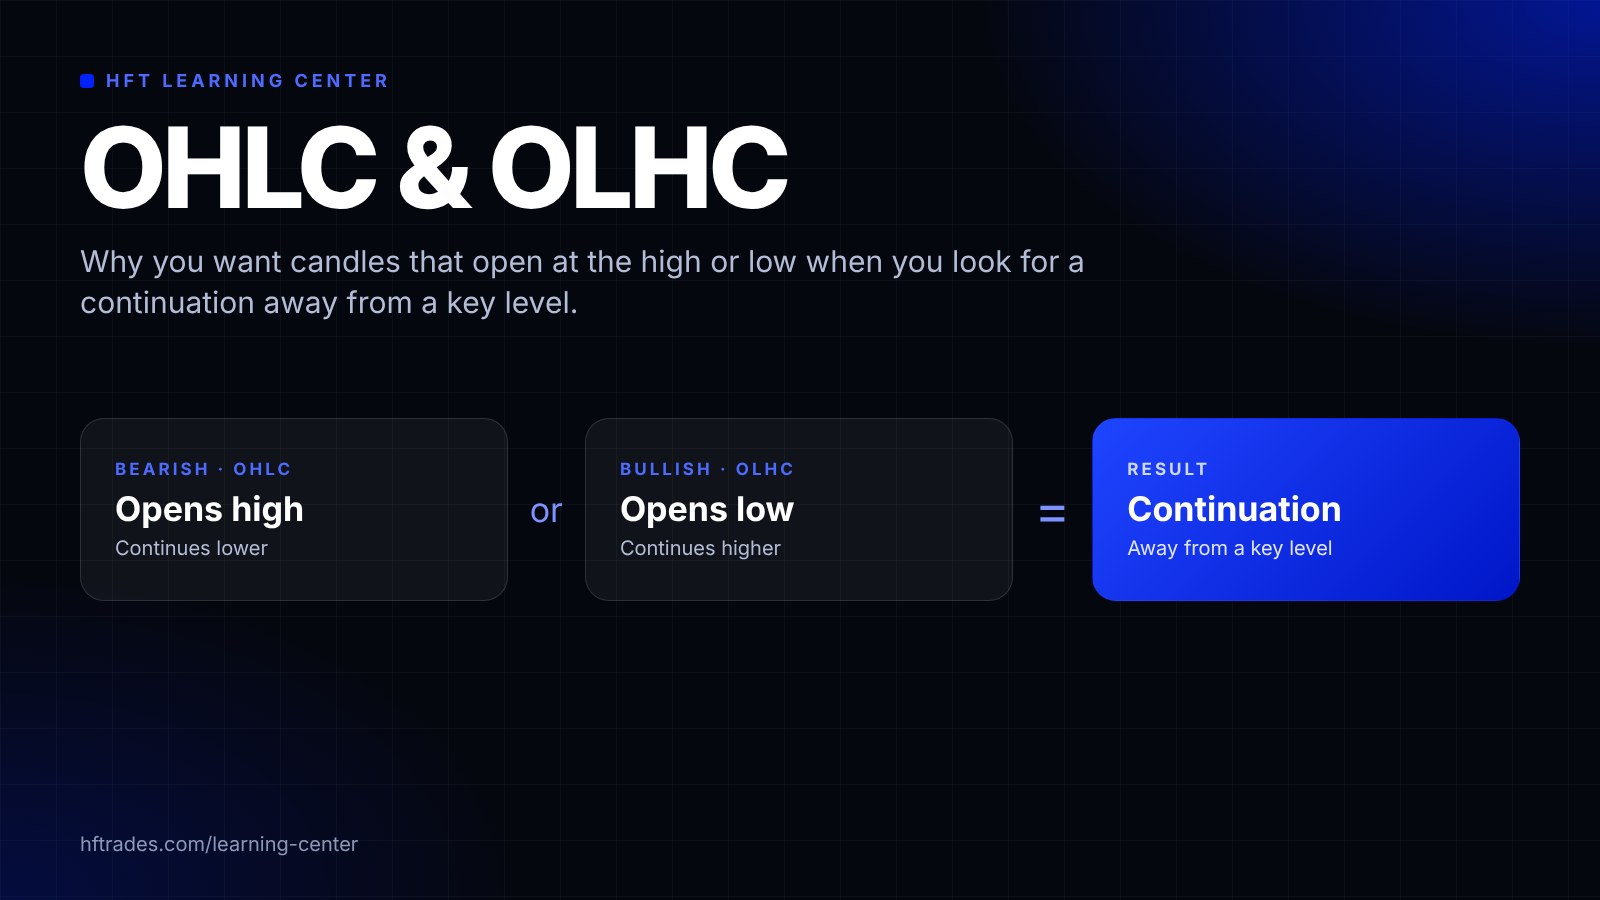
You want candles to open at the high or at the low for continuations away from a key level. A candle that opens high is bearish, and a candle that opens low is bullish.
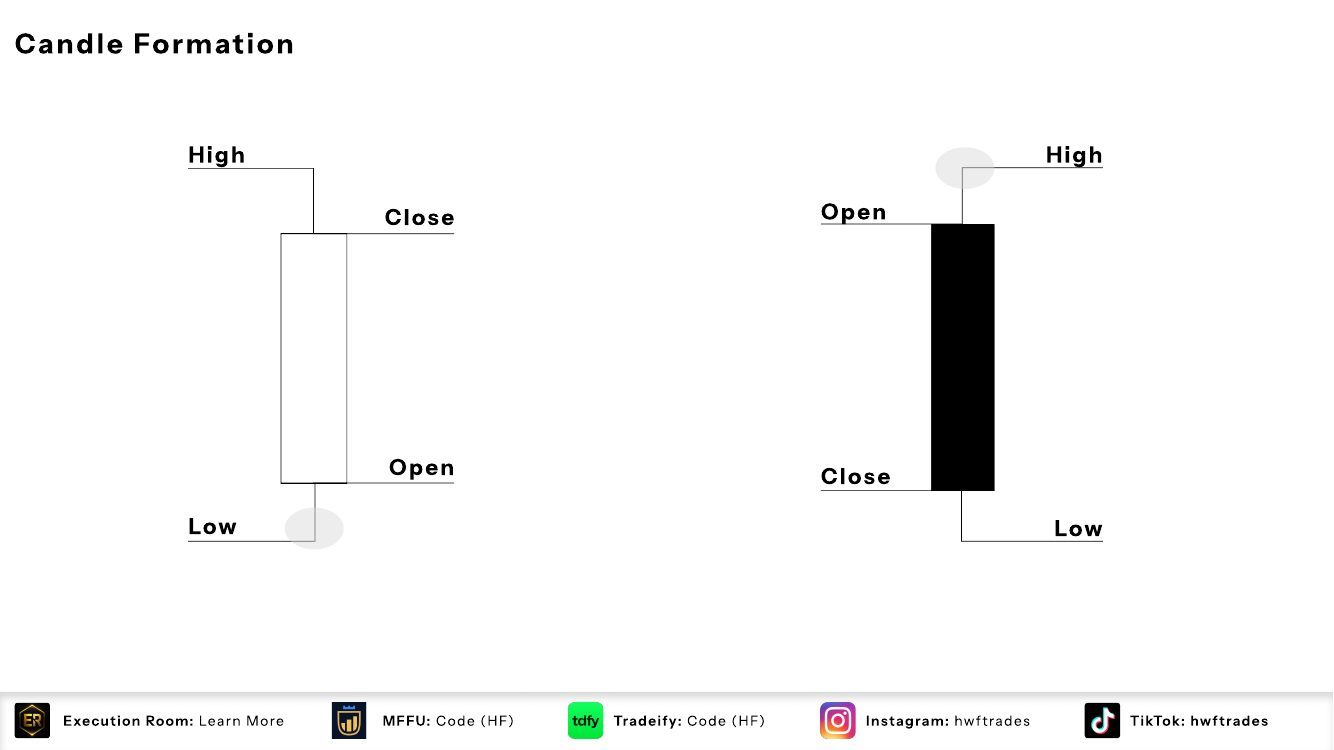
The slide labels the parts of a candle: open, high, low and close. The white candle opens at its low and closes at its high (OLHC). The black candle opens at its high and closes at its low (OHLC).
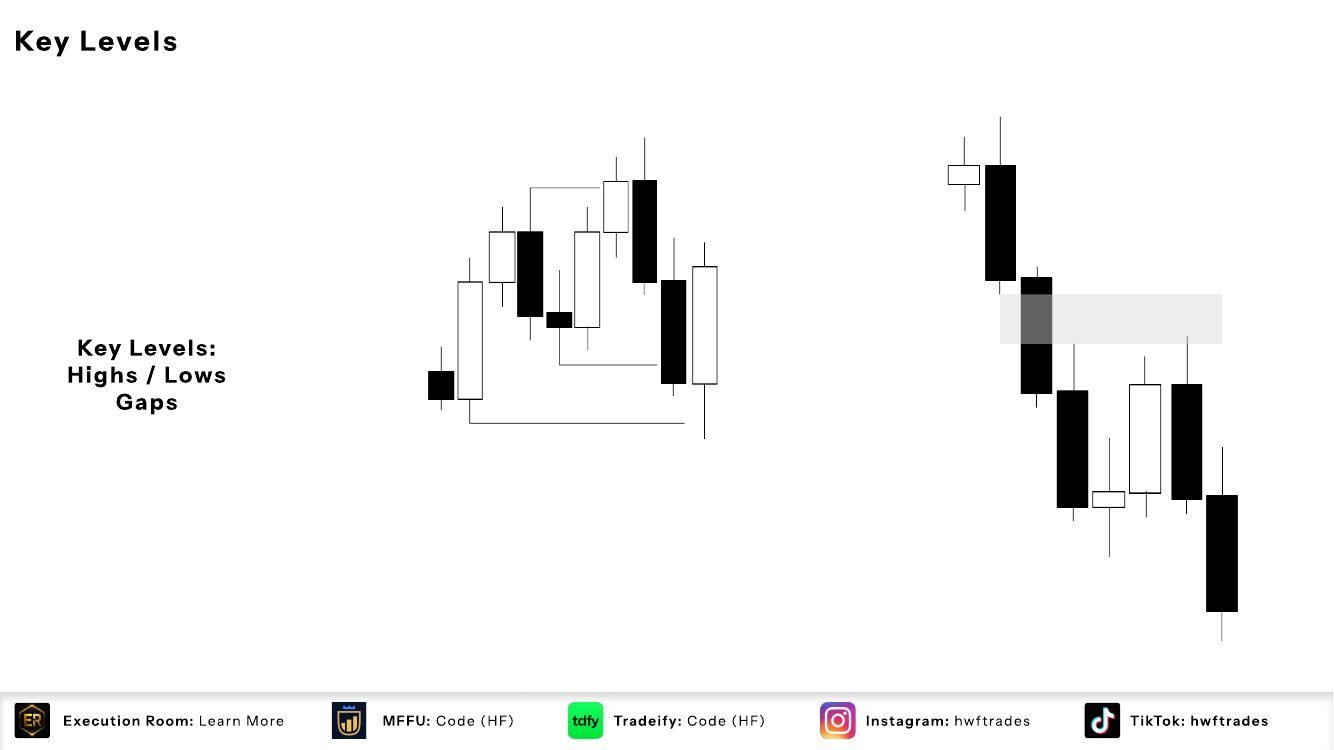
The key levels are highs and lows, and gaps. The left chart shows price reacting from a high or low, and the right chart shows price reacting from a gap.
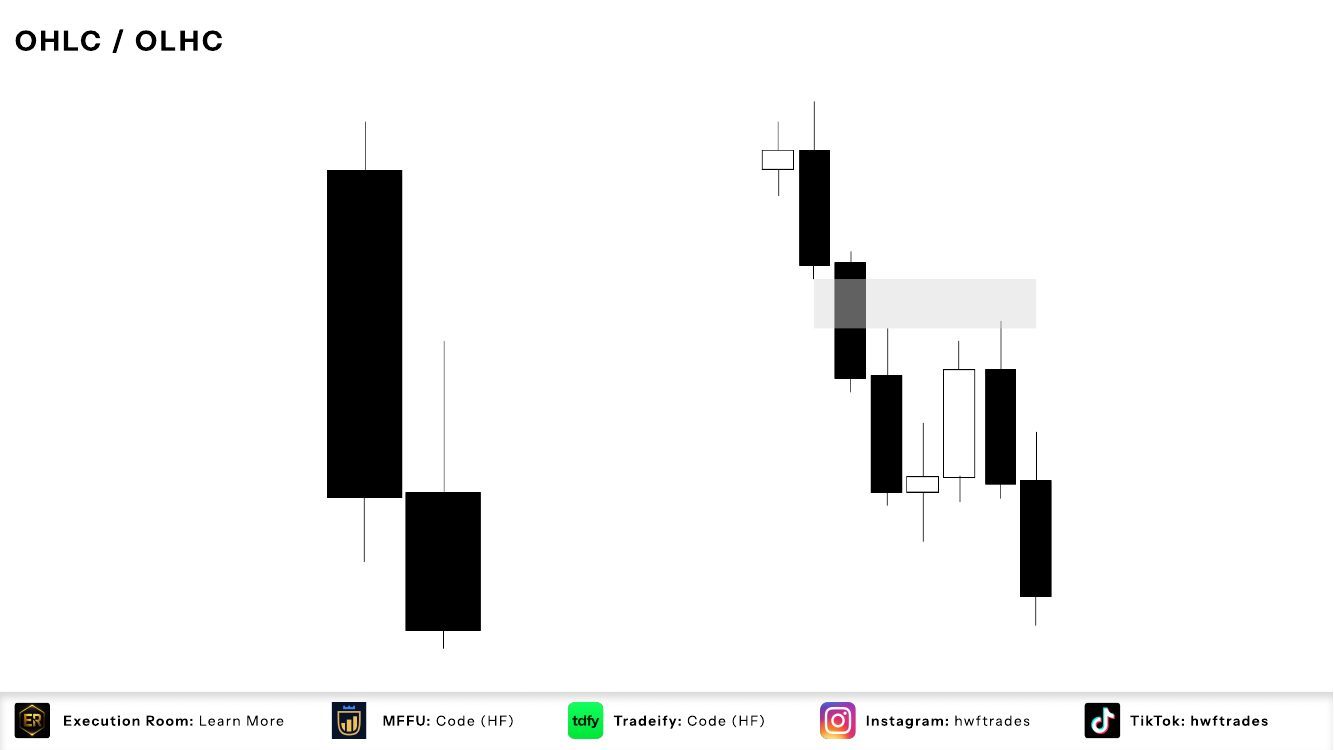
The bearish example. After price reacts from the gap, the candles open at their highs (OHLC) and continue lower, away from the key level. Candles on the left, the same idea on a chart on the right.
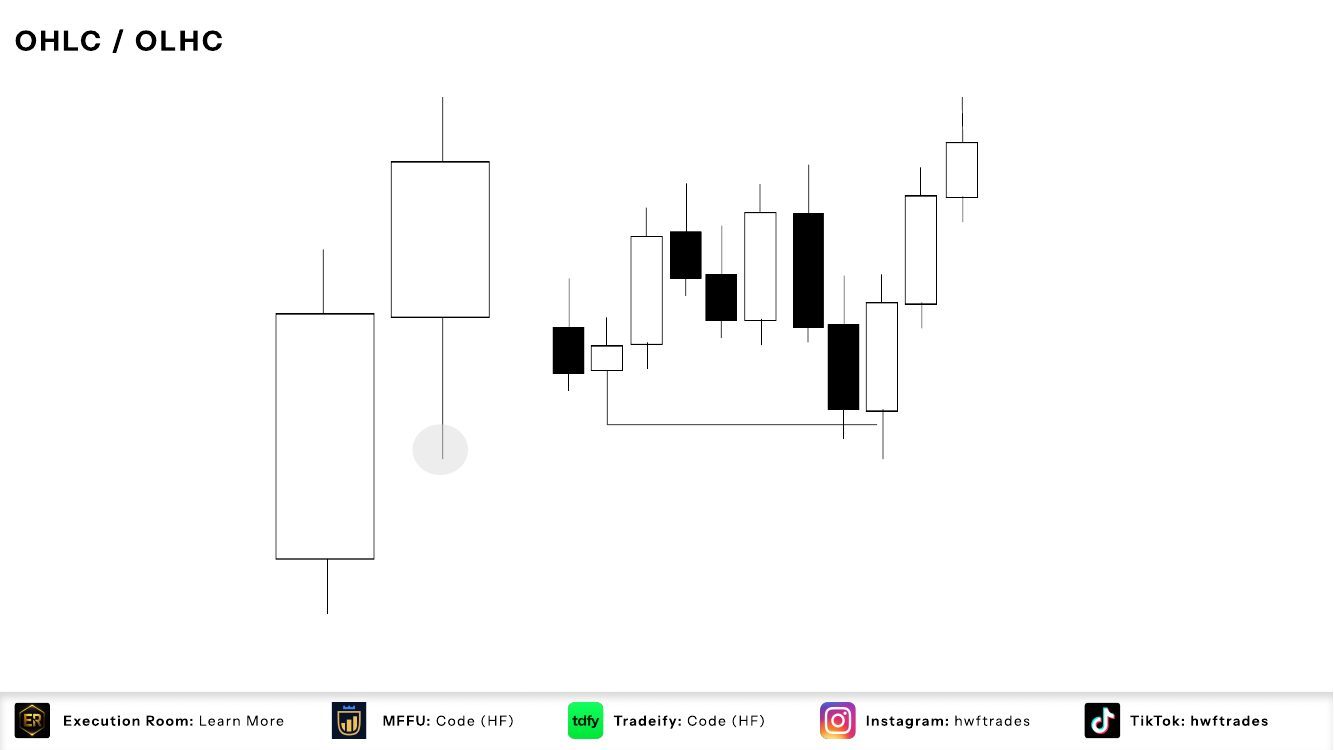
The bullish example. After price takes the low, the candles open at their lows (OLHC) and continue higher, away from the key level. Candles on the left, the same idea on a chart on the right.
New guides land here first, and the newsletter tells you when they do.