Identify The Draw
The lesson has five parts: an introduction, liquidity pools, daily candles, sequences, and how to use it across timeframes.

The slides from the video, with an explanation under each one. Watch the video, then keep the PDF.
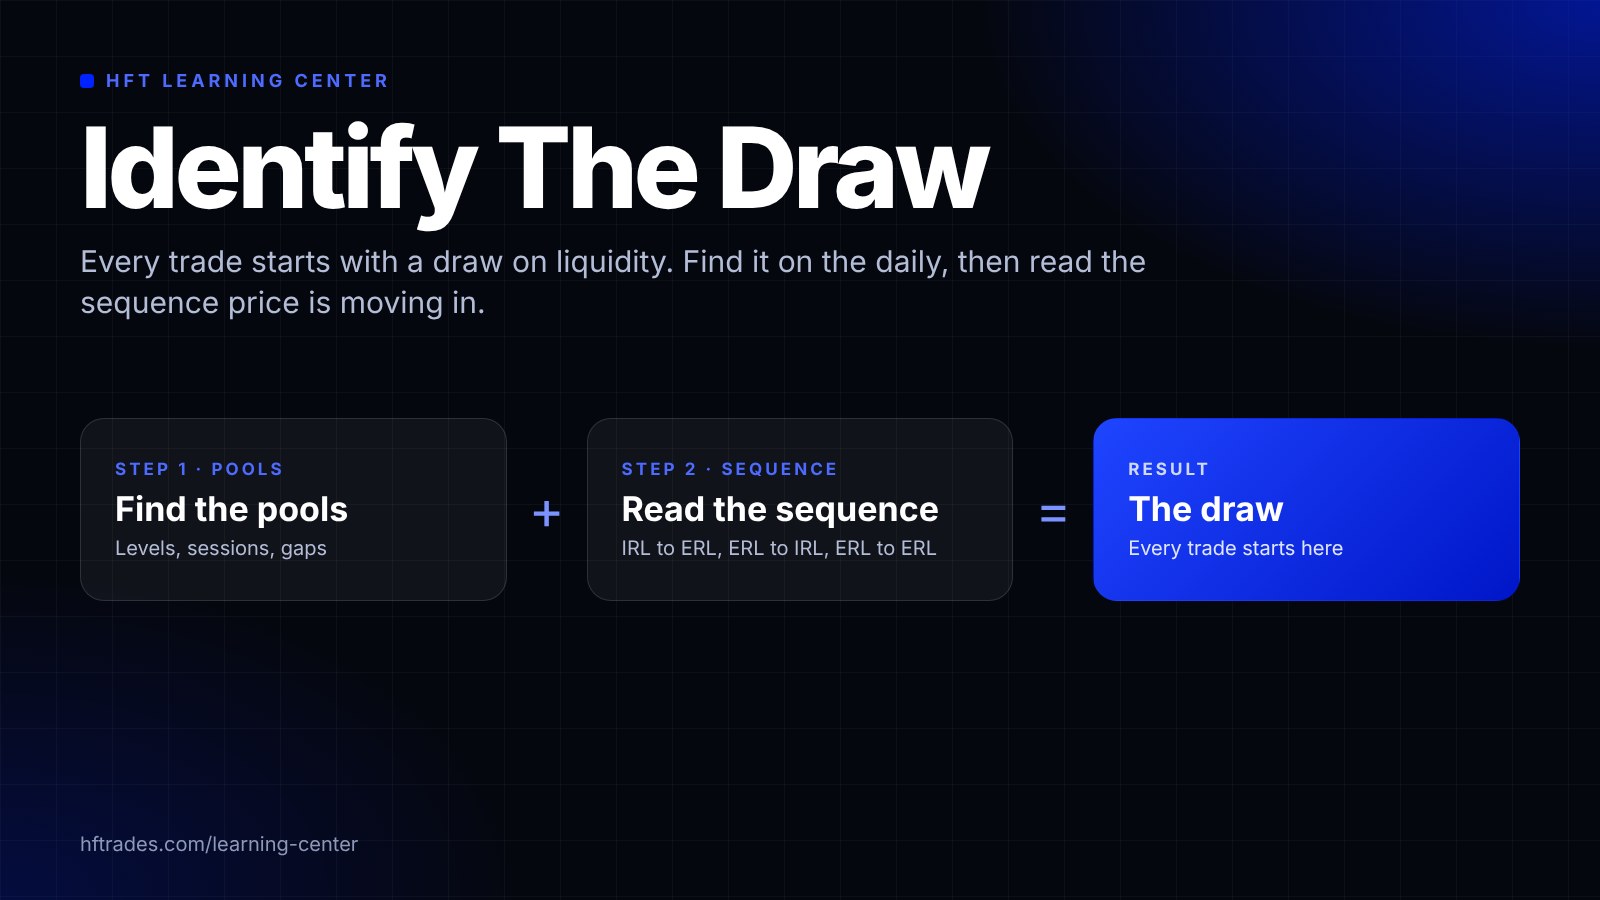
The lesson has five parts: an introduction, liquidity pools, daily candles, sequences, and how to use it across timeframes.
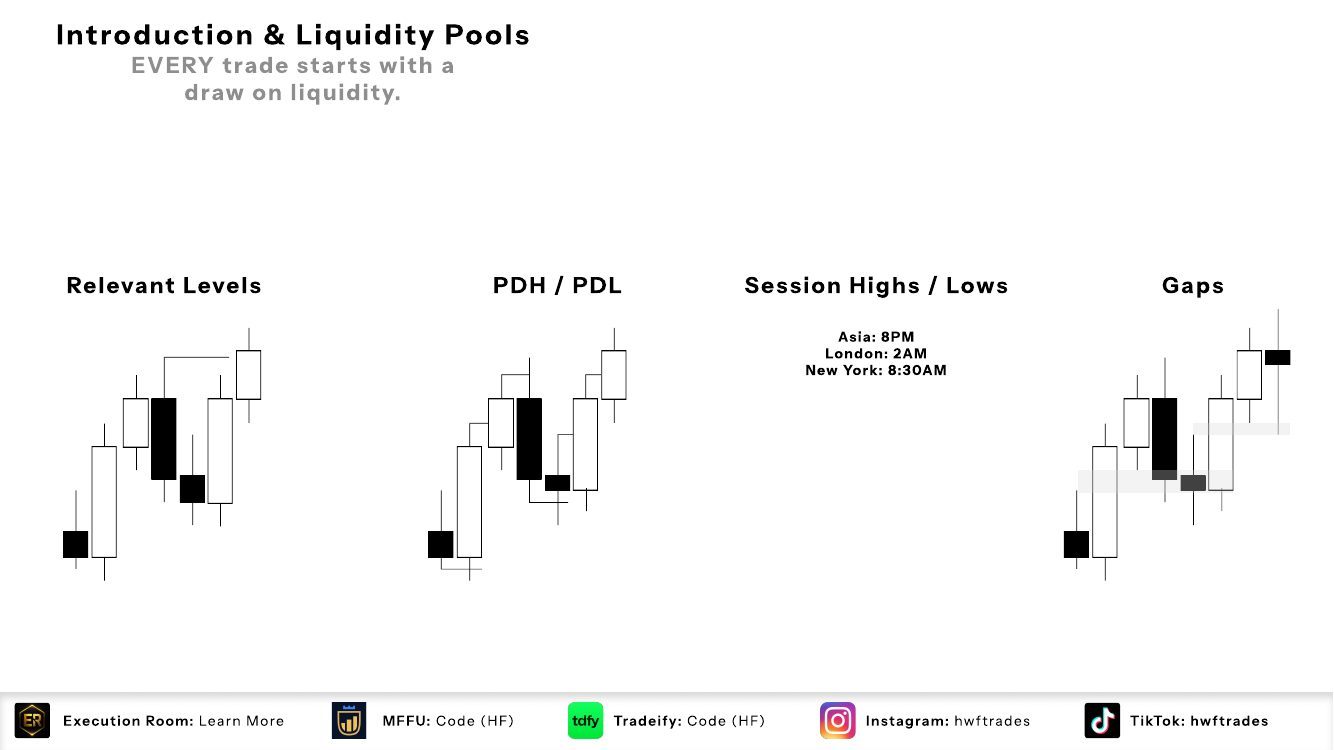
Every trade starts with a draw on liquidity. The four kinds of draw are relevant levels, PDH/PDL, session highs and lows (Asia at 8 PM, London at 2 AM, New York at 8:30 AM), and gaps.
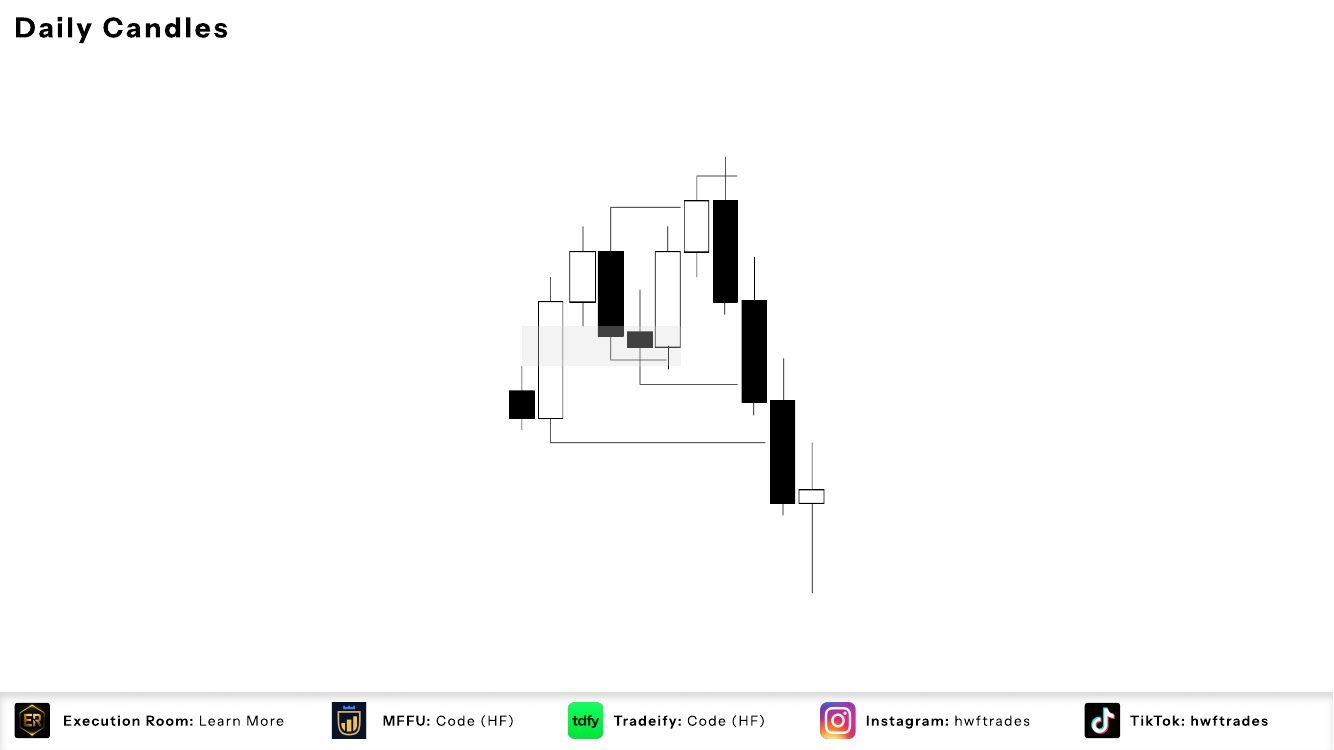
This is how the draw shows up on the daily candles. The chart marks the levels and a gap on the daily, so you can see which level each candle is moving toward.
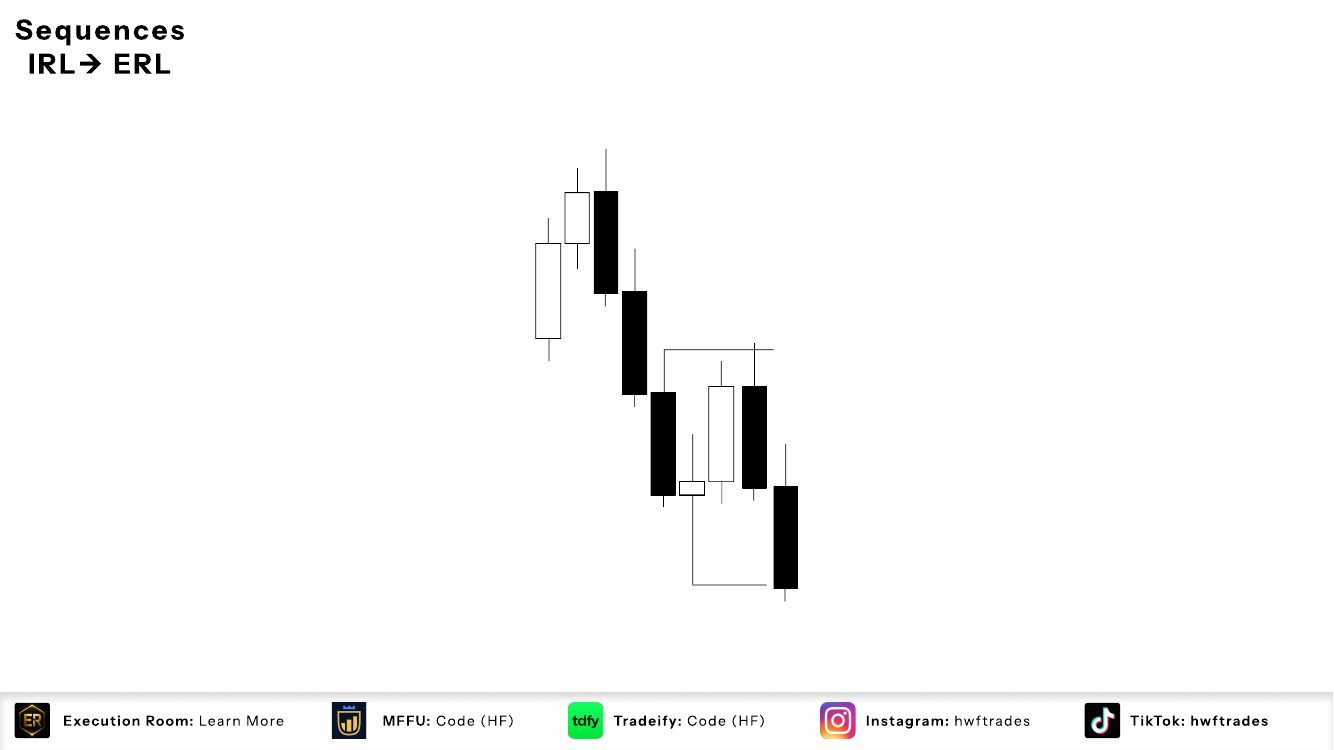
The first sequence is IRL to ERL. Price trades from an internal level, a gap, out to an external level, a high or low. In the example, price works from the gap and runs to the low.
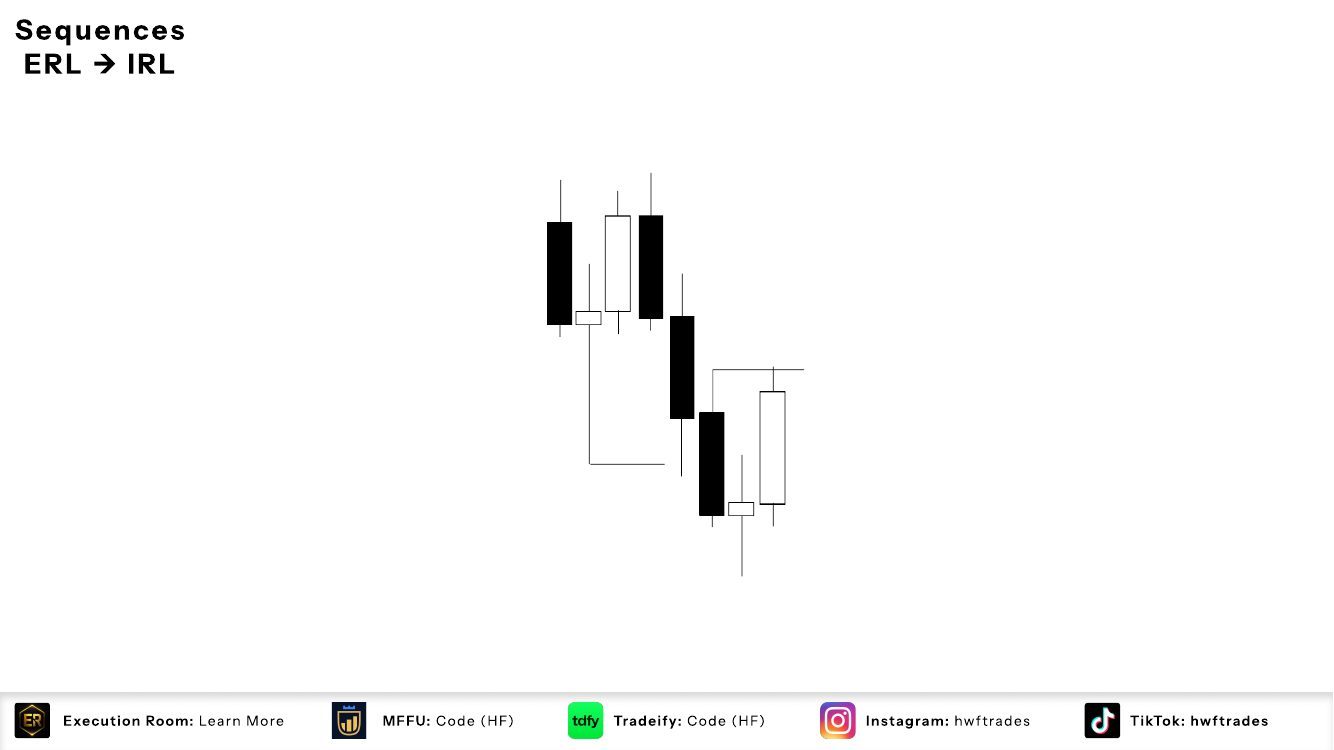
The second sequence is the reverse. Price trades from an external level back into an internal level. In the example, price runs from the external low back up into the gap.
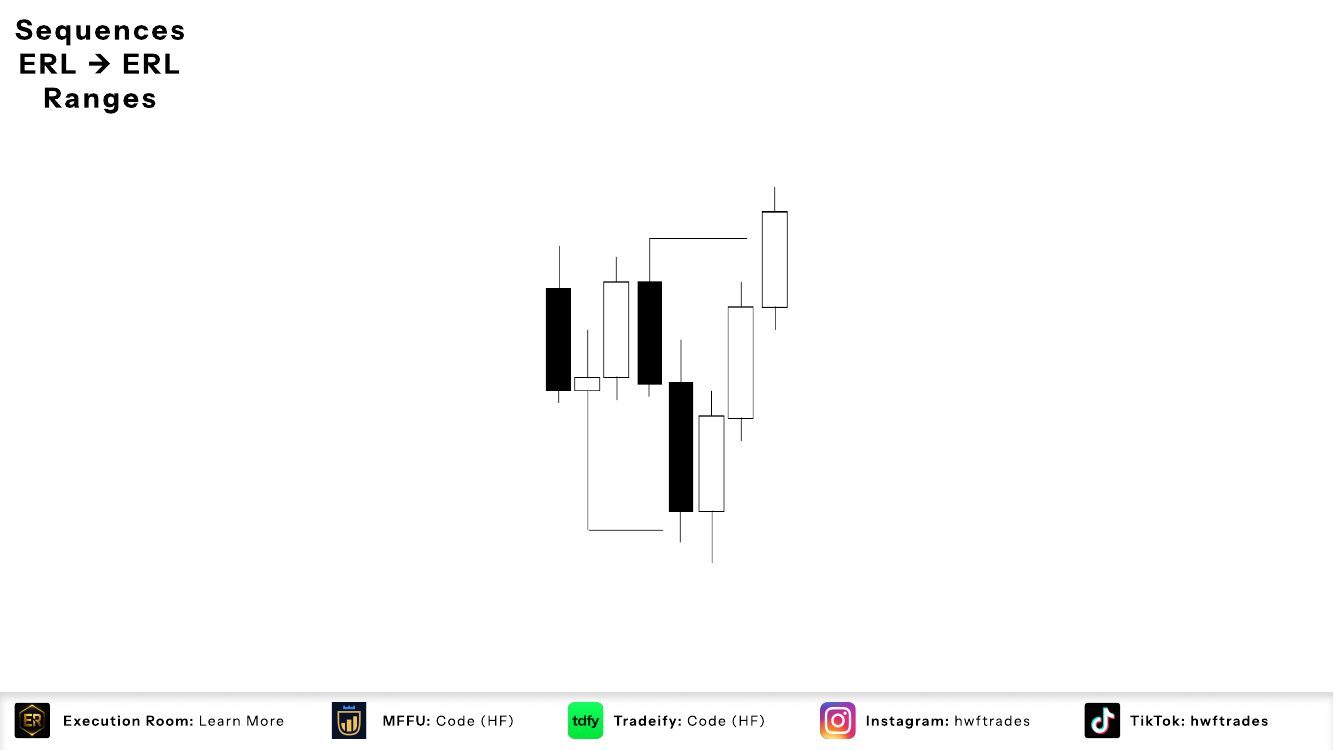
The third sequence is ERL to ERL, which is a range. Price trades from one external level to the other, from the low across to the high, or the other way.
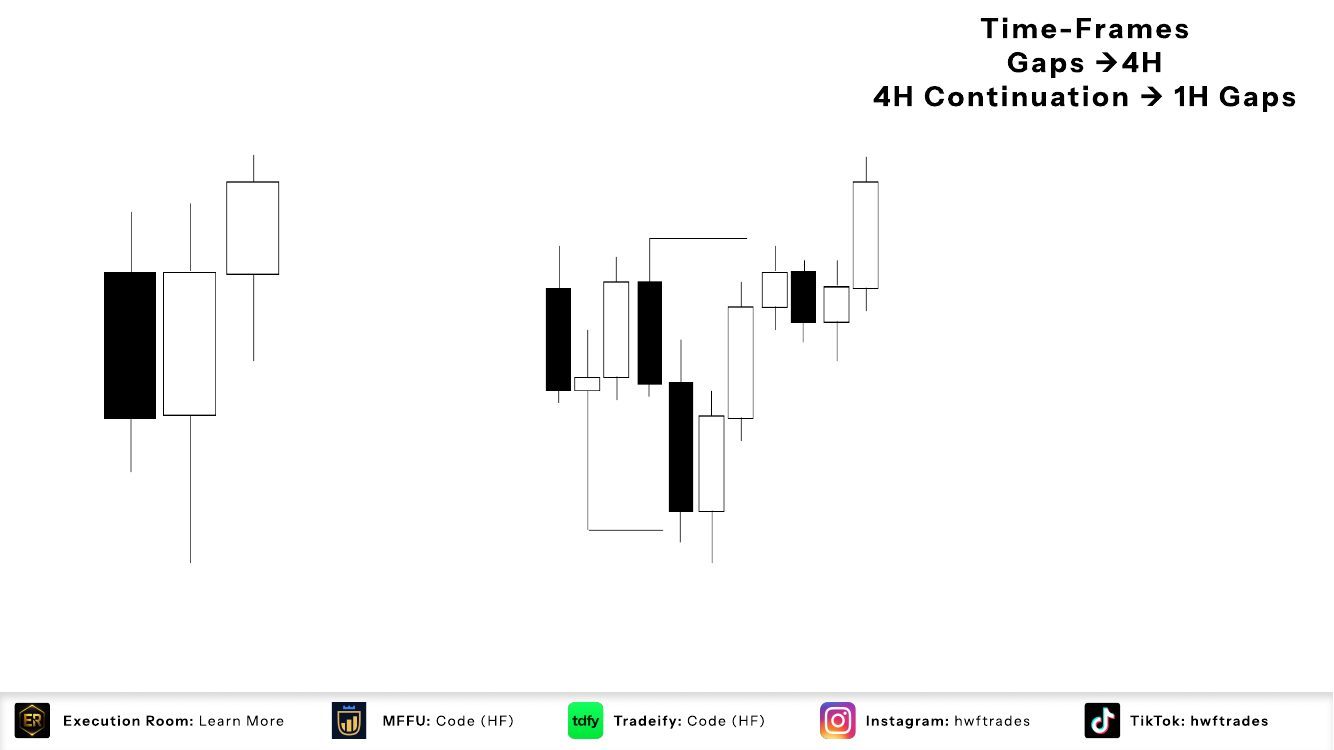
This is how it works across timeframes. Gaps give you the draw on the 4H, and a 4H continuation leads to 1H gaps. The 4H is on the left, and the 1H gaps are on the right.
New guides land here first, and the newsletter tells you when they do.